Image Details
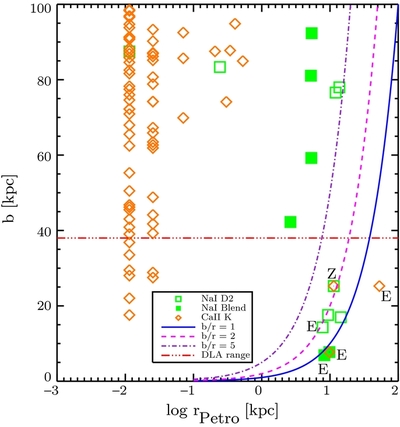
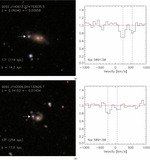
Caption: Figure 10.
Plot of quasar impact parameter vs. SDSS r-band Petrosian radius, for the list of absorbers. The line at 38 kpc represents the impact parameter out to which low- z DLAs have been found by Rao et al. (2003). The three curved lines indicate the ratio of the impact parameter to the r-band Petrosian radius (1, 2, and 5, respectively). The vertical striping apparent in the data at low Petrosian radii is a result of multiple QSO sightlines being found within the 100 kpc search radius of a low-redshift galaxy. The absorbers marked with "E" and "Z" represent the four extragalactic absorbers, and the Zych absorber, discussed in Section 5.
Other Images in This Article


Show More
Copyright and Terms & Conditions
© 2011. The American Astronomical Society. All rights reserved.