Image Details
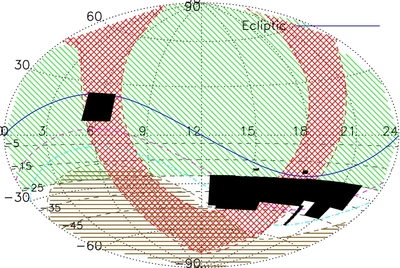
Caption: Figure 1.
Black shaded regions represent the sky area surveyed in this work. The horizontal axis is the right ascension in hours and the vertical axis is the declination in degrees. The blue solid line shows the ecliptic, the magenta dashed line shows −20° from the ecliptic, and the cyan dotted dashed line shows −30° from the ecliptic. Areas more than −40° south of the ecliptic are shown with brown horizontal stripes. The area within 15° of the Galactic Plane is shown with red crossed stripes while the area covered by wide-field KBO surveys from the north (Trujillo & Brown 2003; Brown 2008; Schwamb et al. 2009, 2010) is shown with green angled stripes. Almost all KBOs are expected to be within 20° of the ecliptic with it highly unlikely any KBO is beyond 40° from the ecliptic (Brown 2008).
Other Images in This Article


Show More
Copyright and Terms & Conditions
© 2011. The American Astronomical Society. All rights reserved.