Image Details
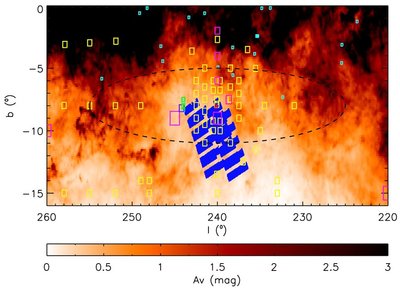
Caption: Figure 1.
Schematic plot of the areas in CMa studied by different authors. The blue area shows the QUEST RRLS survey footprint. The colored rectangles represent the areas studied by Bellazzini et al 2006 (purple), Martinez-Delgado et al. 2005 (red), Carraro et al. 2005 and Moitinho et al. 2006 (cyan), Butler et al. 2007 and de Jong et al. 2007 (yellow), Conn et al. 2007 (magenta), Powell et al. 2008 (dark pink), and Carraro et al. 2008 (green). The axes of the dashed-lined ellipse are equal to the FWHM derived for CMa using an aspect ratio of 5:1 and the FWHM in the b direction measured by Butler et al. (2007). As noted by Butler et al. (2007), the aspect ratio of CMa could be larger than 5:1, in which case the ellipse would be more elongated in longitude. The colorscale represents the A V values obtained from interpolation of the Schlegel et al. (1998) dust maps.
Other Images in This Article
Copyright and Terms & Conditions
© 2009. The American Astronomical Society. All rights reserved.