Image Details
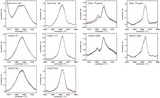
Caption: Figure 5.
Comparison between the normalized mean profiles of the emission lines and the observed dispersion in the line profile, as a function of wavelength. Mean (thick) lines and dispersion (thin) lines are superposed on each plot, with the amplitude of the dispersion multiplied by a factor of 35 (hence a dispersion level of 0.35 on the plot actually corresponds to a dispersion amplitude of 0.01 in normalized flux units).
Other Images in This Article
Copyright and Terms & Conditions
© 2008. The American Astronomical Society. All rights reserved.
Copyright ©
2025 Astronomy Image Explorer. All Rights Reserved.