Image Details
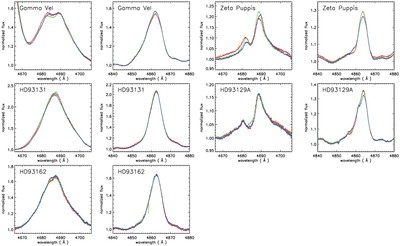
Caption: Figure 1.
Nightly mean spectra of our five program stars, listed in Table 1. For each star, two orders from the échelle spectrogram are shown, with the wavelength regions around the broad, intense emission lines of He ii 4686 (left) and He ii/Hβ 4860 (right). The mean spectra for the nights of 2000 January 25, 26, and 27 are shown in red, green, and blue, respectively.
Other Images in This Article
Copyright and Terms & Conditions
© 2008. The American Astronomical Society. All rights reserved.
Copyright ©
2025 Astronomy Image Explorer. All Rights Reserved.