Image Details
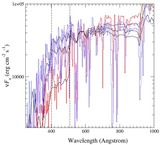
Caption: Figure 8.
Line maps for pointing 1 (bottom row) and pointing 2 (top row) for emission centered near 21986 Å and 22867 Å. Brγ contours themselves are overlaid on each panel. To improve signal to noise, these maps have been block averaged to 0.1'' by 0.1'' pixels (i.e. 2 × 2 binning).
Other Images in This Article

Copyright and Terms & Conditions
© 2008. The American Astronomical Society. All rights reserved.
Copyright ©
2025 Astronomy Image Explorer. All Rights Reserved.