Image Details
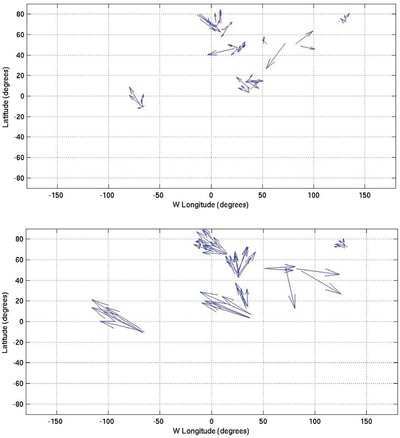
Caption: Figure 4.
Landmark misregistration error versus latitude and longitude plots for overall best fit (top) and best fit constrained to have constant, synchronous spin rate and no pole wobble (bottom). Vector lengths are in units of 100 m, so that a vector that extends across twenty degrees on the plot actually represents a 2 km error. The tail of the arrow corresponds to the location of the first observation of each landmark. The direction of the arrow is the direction of apparent change in the landmark location. Clearly, including spin rate and pole change parameters improves the fit in a systematic manner.
Other Images in This Article

Copyright and Terms & Conditions
© 2008. The American Astronomical Society. All rights reserved.