Image Details
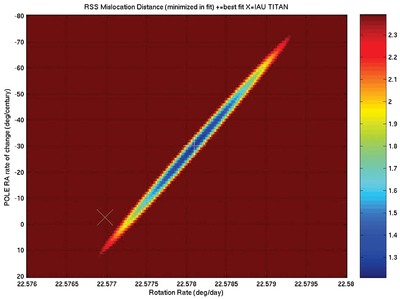
Caption: Figure 3.
Goodness-of-fit pseudo-color map for derivative of POLE_RA and spin rate. The goodness-of-fit metric is E tot/N. The x-axis is spin rate. The y-axis is rate of change in pole right ascension. The color scale goes from dark blue = 1.2 km to dark red > 2.4 km. The X indicates the synchronous no-pole-wobble case. Due to correlation between the two parameters, the locus of good fits is elongated.
Other Images in This Article

Copyright and Terms & Conditions
© 2008. The American Astronomical Society. All rights reserved.
Copyright ©
2025 Astronomy Image Explorer. All Rights Reserved.