

Image Details
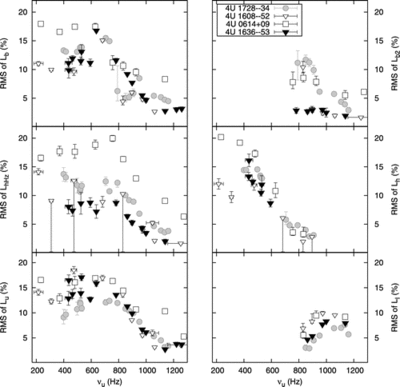
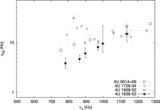
Caption: Fig. 11.
Fractional rms amplitude of all components (except ﹩L_{\mathrm{LF}\,}﹩) vs. ﹩\nu _{u}﹩. The symbols are labeled in the top right plot. The data for 4U 1728−34, 4U 1608−52, and 4U 0614+09 were taken from van Straaten et al. (2005). Note that for ﹩L_{\mathrm{hHz}\,}﹩ and ﹩L_{h}﹩ of 4U 1608−52, the three triangles with vertical error bars which intersect the abscissa represent 95% confidence upper limits (see van Straaten et al. [2003] for a discussion). Also note that we exclude the three points in the rmsℓ vs. ﹩\nu _{u}﹩ plot which were identified as Lℓow by van Straaten et al. (2003).
Other Images in This Article
Show More
Copyright and Terms & Conditions
© 2008. The American Astronomical Society. All rights reserved. Printed in U.S.A.

