

Image Details
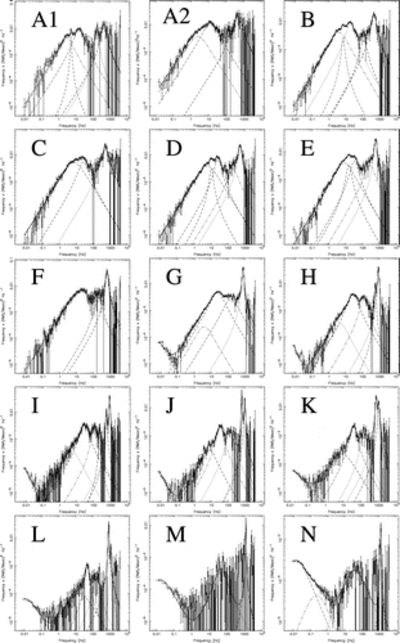
Caption: Fig. 4.
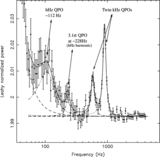
Power spectra and fit functions in the power spectral density times frequency representation. Each plot corresponds to a different region in the CCDs and color‐intensity diagrams (see Figs. 1 and 2). The curves mark the individual Lorentzian components of the fit. For detailed identification, see Table 3 and Fig. 5.
Other Images in This Article
Show More
Copyright and Terms & Conditions
© 2008. The American Astronomical Society. All rights reserved. Printed in U.S.A.

Copyright ©
2026 Astronomy Image Explorer. All Rights Reserved.
