Image Details
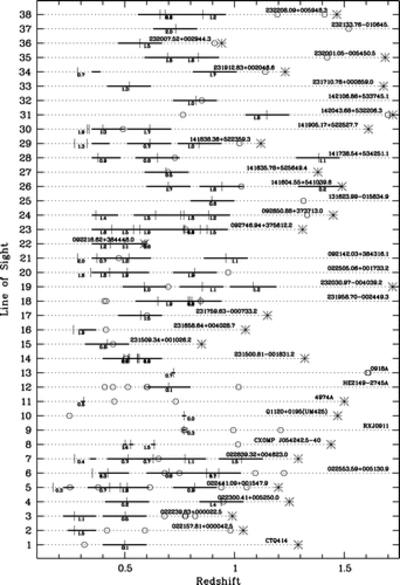
Caption: Fig. 3.
Diagram of the subset of LOSs toward which Mg II absorption systems were found. The LOS numbering is the same as used in Tables 2 and 3. LOSs up to 19 belong to sample S1, LOSs 20–38 to sample S2. Quasar emission redshifts are labeled with asterisks, Mg II absorption systems with circles, and clusters with vertical lines. The thick lines depict the redshift intervals [zmin, zmax] around cluster redshifts. These intervals permit a 3 σ detection of Mg II λ2796 lines with ﹩W_{0}> W^{\mathrm{min}\,}_{0}=0.05﹩ Å in S1 and with ﹩W_{0}> W^{\mathrm{min}\,}_{0}=1.0﹩ Å in S2. The numbers below the thick lines are the projected LOS‐cluster distance in ﹩h^{-1}_{71}﹩ Mpc at cluster redshift.
Other Images in This Article

Copyright and Terms & Conditions
© 2008. The American Astronomical Society. All rights reserved. Printed in U.S.A.