Image Details
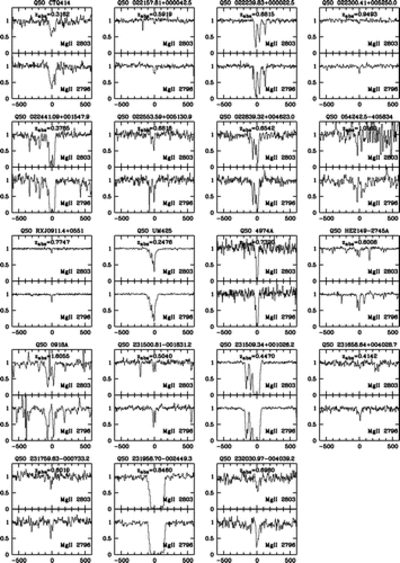
Caption: Fig. 2.
Selected Mg II absorption line systems in each of the 19 spectra comprising the high‐resolution sample, S1. Each panel (normalized flux vs. rest‐frame velocity in km s−1) shows the strongest Mg II doublet in the spectrum, unless an absorption redshift is within [zmin, zmax] of a cluster in the same LOS, in which case the latter system is plotted. Associated systems (﹩z_{\mathrm{abs}\,}\sim z_{\mathrm{em}\,}﹩) were not considered.
Other Images in This Article

Copyright and Terms & Conditions
© 2008. The American Astronomical Society. All rights reserved. Printed in U.S.A.
Copyright ©
2025 Astronomy Image Explorer. All Rights Reserved.