Image Details
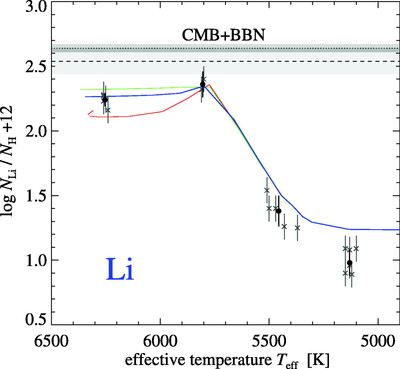
Caption: Fig. 8.
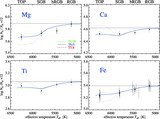
Observed trends of lithium. Crosses indicate individual stellar abundances, while filled circles show group averages. Solid lines represent the atomic diffusion model predictions (see Fig. 6), which have an original abundance as given by the dashed line [﹩\mathrm{log}\,\varepsilon ( \mathrm{Li}\,) =2.54\pm 0.1﹩]. The dark shaded area shows the predicted primordial lithium abundance ["CMB+BBN:" ﹩\mathrm{log}\,\varepsilon ( \mathrm{Li}\,) =2.64\pm 0.03﹩; Spergel et al. 2007].
Other Images in This Article
Show More
Copyright and Terms & Conditions
© 2007. The American Astronomical Society. All rights reserved. Printed in U.S.A.
Copyright ©
2025 Astronomy Image Explorer. All Rights Reserved.