Image Details
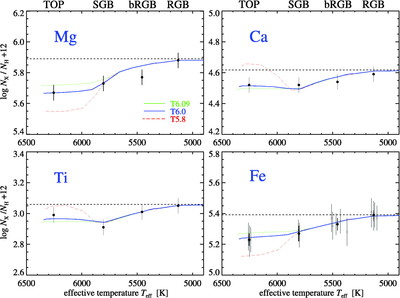
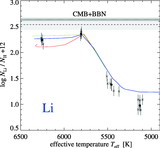
Caption: Fig. 6.
Observed trends of elemental abundances with evolutionary stage (filled circles with error bars) compared to predictions from stellar evolution models including atomic diffusion and turbulent mixing with three different efficiencies. Note how the T5.8 model falls below or above the best‐fitting T6.0 model depending on the element (likewise the T6.09 model). For details, see text.
Other Images in This Article
Show More
Copyright and Terms & Conditions
© 2007. The American Astronomical Society. All rights reserved. Printed in U.S.A.
Copyright ©
2025 Astronomy Image Explorer. All Rights Reserved.