Image Details
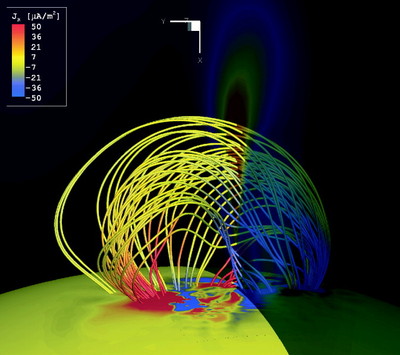
Caption: Fig. 3.
Three‐dimensional structure of the stressed field lines of the evolving magnetic dipole in the case of CE1 at ﹩t=t_{S}﹩. The color code along the field lines visualizes the radial component of the current density, ﹩J_{R}﹩. The radial velocity of the erupting magnetic field is shown on a translucent plane cutting through the middle of the flux rope; the red (yellow) color corresponds to a flow velocity of the order of 1000 ﹩\mathrm{km}\,\,\mathrm{s}\,^{-1}﹩ (700 ﹩\mathrm{km}\,\,\mathrm{s}\,^{-1}﹩). The SB is shown as the yellow sphere. The flux rope in the case of CE2 looks qualitatively similar. This figure is also available as an mpeg animation.
Other Images in This Article
Copyright and Terms & Conditions
© 2007. The American Astronomical Society. All rights reserved. Printed in U.S.A.