Image Details
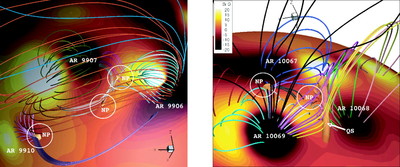
Caption: Fig. 2.
Magnetic topologies for CE1 (left) and CE2 at ﹩t=0﹩. The background color in each image shows ﹩B_{R}﹩ at the SB; the magnetic field is a superposition of the potential field extrapolated from SOHO MDI data and that of the dipole. The ARs of interest are annotated as shown. The colored lines are 3D magnetic field lines, where each color represents a distinct flux system. The blue (black) field lines in the left (right) image are open in IP space. The magnetic null points (NPs) in the corona are encircled. In the case of CE2, there is a quasi‐separator (QS) extending from a local minimum of B at the solar surface through a NP higher up in the corona (between the three ARs shown). We used the plasma‐β as a proxy to visualize the NPs and QS, which are shown here as isosurfaces of ﹩\beta =0.2﹩ and ﹩\beta =0.1﹩, respectively.
Other Images in This Article
Copyright and Terms & Conditions
© 2007. The American Astronomical Society. All rights reserved. Printed in U.S.A.