Image Details
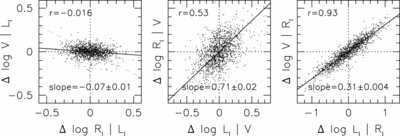
Caption: Fig. 12.
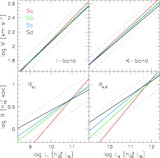
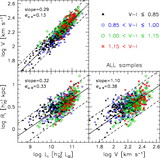
Correlations between the residuals of the VRL relations for the I‐band sample (top) and K‐band sample (bottom). The best‐fitting slopes with 1 σ uncertainty and correlation coefficients are given in the lower and upper left corner of each panel. There is only a weak correlation between ﹩V\vert L﹩ and ﹩R\vert L﹩ (left) compared to the prediction for pure disk only model (dashed line with slope −0.5). There is a significant correlation between the ﹩L\vert V﹩ and ﹩R\vert V﹩ residuals (middle), and even tighter correlation between ﹩V\vert R﹩ and ﹩L\vert R﹩, which is simply the VL relation in differential form.
Other Images in This Article


Show More
Copyright and Terms & Conditions
© 2007. The American Astronomical Society. All rights reserved. Printed in U.S.A.