Image Details
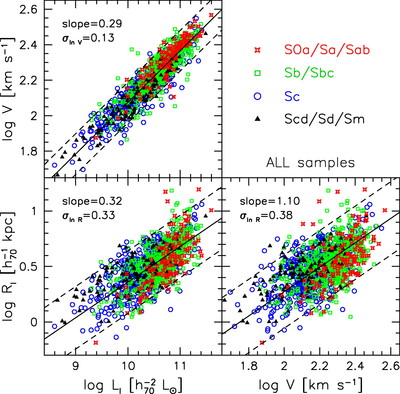
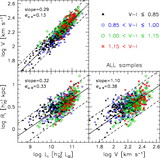
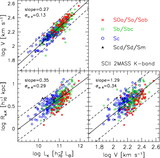
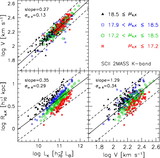
Caption: Fig. 3.
VRL scaling relations for all four samples color‐coded by Hubble types. The linear orthogonal fits, shown by the solid lines, are reported in Table 2 for the combined samples; the 2 σ observed scatter are given by the dashed lines.
Other Images in This Article


Show More
Copyright and Terms & Conditions
© 2007. The American Astronomical Society. All rights reserved. Printed in U.S.A.
Copyright ©
2025 Astronomy Image Explorer. All Rights Reserved.