Image Details
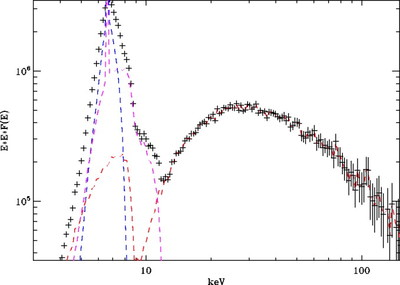
Caption: Fig. 13.
Central source spectrum reprocessed through the wind shell. Top: ﹩\beta =0.1﹩ and ﹩\tau _{0}=2﹩ or 4. Bottom: ﹩\beta =0.3﹩. In the X‐ray spectrum of the central source, the photon numbers are the same in the blackbody and hard components. In fact, the ratio of the photon numbers is arbitrary, and it depends on the illumination of the Compton cloud by the source of the blackbody radiation. In this simulation we assume the blackbody color temperature is 1.2 keV. The resulting spectrum is shown by the black histogram, whereas orange and pink lines present the hard and blackbody components of the central source reprocessed in the wind, respectively. A blue line is the Kα line formed in the wind. One can clearly see the strong fluorescent Kα line, K edge, formed in the wind and a prominent bump around 25 keV. The line consists of narrow and broad components (see narrow blue peak at 6.4 keV in all spectra).
Other Images in This Article
Show More
Copyright and Terms & Conditions
© 2007. The American Astronomical Society. All rights reserved. Printed in U.S.A.