Image Details
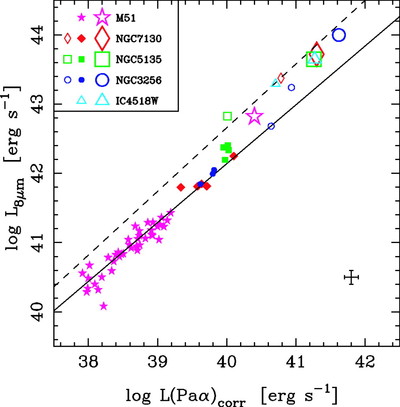
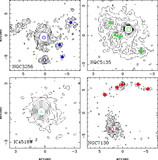
Caption: Fig. 3.
Monochromatic (﹩\nu f_{\nu }﹩) 8 μm vs. extinction‐corrected Paα luminosities. The small open and filled symbols are the nuclei and high surface brightness H II regions (see Fig. 2) of LIRGs, respectively. The photometry for NGC 3256 and NGC 7130 is through a 1﹩\farcs﹩4 (240 and 440 pc, respectively) diameter aperture. Crowding effects are likely to be present for the photometry of the circumnuclear H II regions of NGC 5135, even for the 1﹩\farcs﹩1 (270 pc) aperture used. The error bar indicates the typical uncertainties associated with the photometry and the T‐ReCS to IRAC flux density conversion (see § 2). The large open symbols for the LIRGs indicate the integrated properties over the HST NICMOS FOV (~﹩19^{\prime \prime }\times 19^{\prime \prime }﹩). The central 6 kpc M51 H II regions (photometry for ~520 pc diameter apertures) and integrated emission from CAL05 are shown as star symbols. The IRAC 8 μm photometry is corrected for extended source emission as described by Pérez‐González et al. (2006). The solid line is our least‐squares fit to the M51 H II region data from CAL05 extrapolated to the LIRG luminosities. The dashed line is the nonlinear fit from Wu et al. (2005) for star‐forming galaxies where the Hα luminosities have been converted to Paα ones assuming case B recombination.
Other Images in This Article
Copyright and Terms & Conditions
© 2006. The American Astronomical Society. All rights reserved. Printed in U.S.A.
Copyright ©
2026 Astronomy Image Explorer. All Rights Reserved.