Image Details
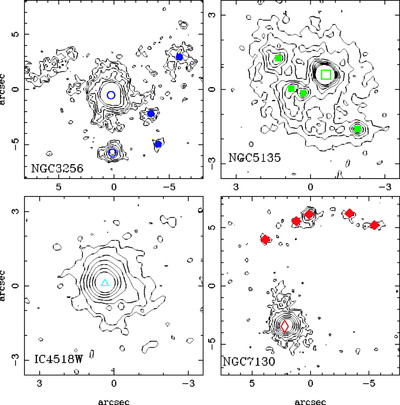
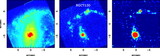
Caption: Fig. 2.
T‐ReCS MIR emission contour plots in a logarithmic scale except for NGC 5135 for which the scale is linear. North is up, and east is to the left. For each galaxy, the open symbols mark the nuclei, whereas the filled symbols indicate the positions of high surface brightness regions for which photometry was obtained (see also Fig. 3). For NGC 3256 we mark the locations of the north and south nuclei, also detected at NIR (Kotilainen et al. 1996) and radio (Neff et al. 2003) wavelengths.
Other Images in This Article
Copyright and Terms & Conditions
© 2006. The American Astronomical Society. All rights reserved. Printed in U.S.A.
Copyright ©
2026 Astronomy Image Explorer. All Rights Reserved.