Image Details
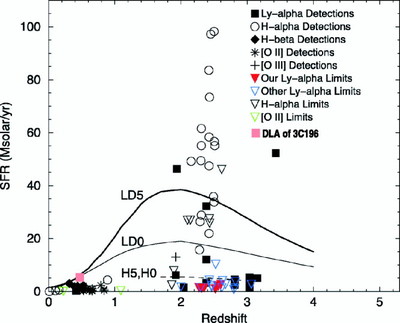
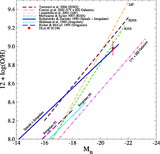
Caption: Fig. 6.
SFR vs. redshift for candidate objects in QSO absorber fields from emission‐line imaging and spectroscopic searches for Lyα, Hα, Hβ, [O II], and [O III], from Kulkarni et al. (2006 and references therein). The solid curves show the LD5 and LD0 "large disk" calculations of Bunker et al. (1999) (for ﹩q_{0}=0.5﹩ and 0, respectively). The curve for ﹩\Omega _{\Lambda }=0.7﹩ and ﹩\Omega _{m}=0.3﹩ should be between these two curves. The dashed curve shows their H5 and H0 predictions for the hierarchical hypothesis.
Other Images in This Article
Copyright and Terms & Conditions
© 2007. The American Astronomical Society. All rights reserved. Printed in U.S.A.
Copyright ©
2025 Astronomy Image Explorer. All Rights Reserved.