Image Details
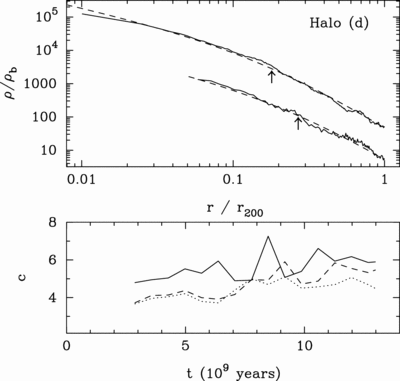
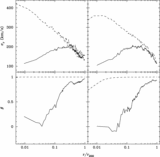
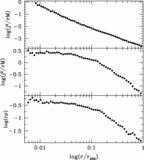
Caption: Fig. 4.
Top: Density profile of halo d at early (﹩z=1.72﹩, dashed line) and late (﹩z=0﹩, solid line) times. The former is offset by 1 dex. Arrows indicate the NFW scale length rs. Bottom: Concentration parameter of the NFW fit to density profiles for the halos as they evolve in time. The solid line represents halo b, the dashed line represents halo d, and the dotted line represents halo e.
Other Images in This Article

Show More
Copyright and Terms & Conditions
© 2006. The American Astronomical Society. All rights reserved. Printed in U.S.A.
Copyright ©
2025 Astronomy Image Explorer. All Rights Reserved.