Image Details
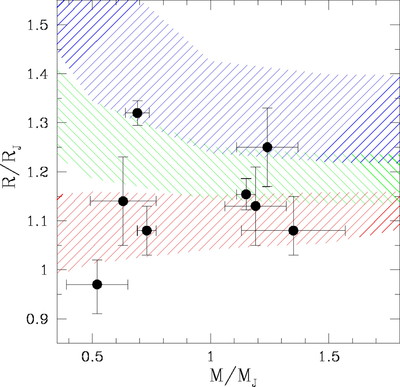
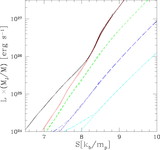
Caption: Fig. 16.
Radius vs. mass for observed transiting planets compared to our cooling model. The points with error bars give the observed masses and radii, as listed in Table 1. The lower (red), middle (green), and upper (blue) hatched areas denote ﹩T_{\mathrm{deep}\,}=500﹩, 2500, and 3000 K, respectively. For each ﹩T_{\mathrm{deep}\,}﹩ and M, the spread in R denotes ages 1 (top) to 10 Gyr (bottom) in each hatched region. HD 149026’s small radius places it well outside the plot.
Other Images in This Article

Show More
Copyright and Terms & Conditions
© 2006. The American Astronomical Society. All rights reserved. Printed in U.S.A.
Copyright ©
2025 Astronomy Image Explorer. All Rights Reserved.