Image Details
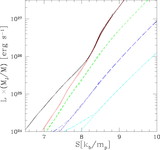
Caption: Fig. 2.
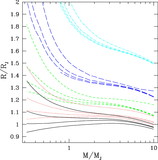
Run of temperature vs. pressure for numerical models with ﹩T_{\mathrm{deep}\,}=500﹩, 1000, 2000, and 3000 K, ﹩Sm_{p}/ k_{\mathrm{B}\,}=7﹩, 8, 9, and 10, and ﹩M/ M_{\mathrm{J}\,}=0.32﹩, 1.0, and 3.2. Only the 19 curves in the age range 0.1–10 Gyr are shown out of the total 48 curves. The circles show the position of the radiative‐convective boundary. The triangles mark the center of the planet. Curves for different masses at the same S and ﹩T_{\mathrm{deep}\,}﹩ nearly overlie each other. The two nearly vertical lines show contours of constant density ﹩\rho =0.01﹩ (left) and 0.1 g cm−3 (right).
Other Images in This Article

Show More
Copyright and Terms & Conditions
© 2006. The American Astronomical Society. All rights reserved. Printed in U.S.A.