Image Details
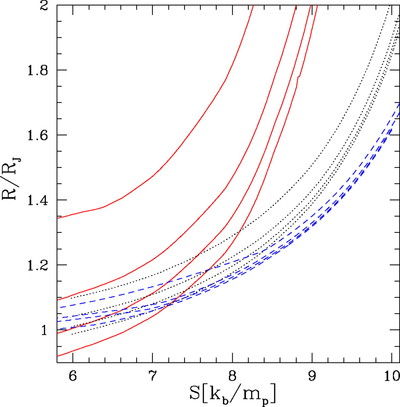
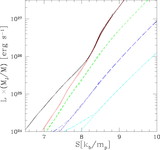
Caption: Fig. 11.
Radius vs. core entropy for different masses and irradiation. Solid red, dotted black, and dashed blue lines represent masses ﹩M/ M_{\mathrm{J}\,}=0.32﹩, 1.0, and 3.2, respectively. Each group of lines represents ﹩T_{\mathrm{deep}\,}=500﹩, 1500, 2500, and 3500 K, from bottom to top.
Other Images in This Article

Show More
Copyright and Terms & Conditions
© 2006. The American Astronomical Society. All rights reserved. Printed in U.S.A.
Copyright ©
2025 Astronomy Image Explorer. All Rights Reserved.