Image Details
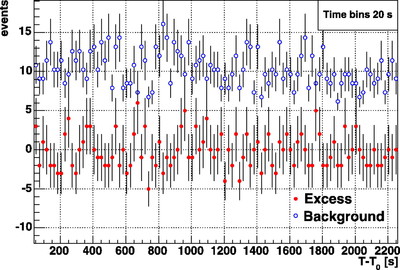
Caption: Fig. 3.
Filled circles, number of excess events for 20 s intervals in the 37 minute window after the burst; open circles, number of background events in the signal region.
Other Images in This Article
Copyright and Terms & Conditions
© 2006. The American Astronomical Society. All rights reserved. Printed in U.S.A.
Copyright ©
2025 Astronomy Image Explorer. All Rights Reserved.