Image Details
Caption: Fig. 2.
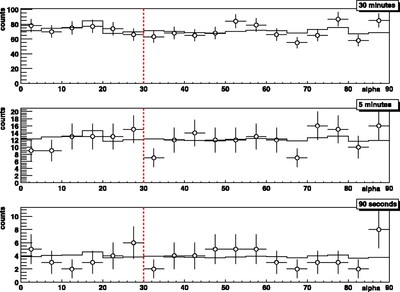
Hillas "alpha" distributions of events with 175 GeV < E < 225 GeV for three different time intervals starting at T = T0 + 40 s: 30 minutes (top), 5 minutes (middle), and 90 s (bottom). Circles refer to ON data, the solid line to OFF data. The dashed vertical line bounds the region where we would expect the γ‐ray signal.
Other Images in This Article
Copyright and Terms & Conditions
© 2006. The American Astronomical Society. All rights reserved. Printed in U.S.A.
Copyright ©
2025 Astronomy Image Explorer. All Rights Reserved.