Image Details
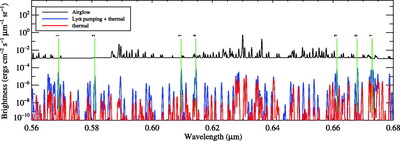
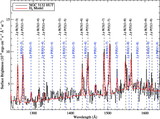
Caption: Fig. 8.
Airglow spectrum and rovibrational cascade at a resolution of 1.6 Å, on a logarithmic scale. The black line is the airglow spectrum, while the red and blue lines are the thermal and co‐added (thermal + fluorescent) models, respectively.
Other Images in This Article

Copyright and Terms & Conditions
© 2006. The American Astronomical Society. All rights reserved. Printed in U.S.A.
Copyright ©
2025 Astronomy Image Explorer. All Rights Reserved.