Image Details
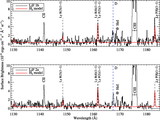
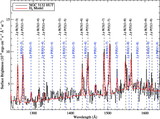
Caption: Fig. 7.
Airglow spectrum reconstructed from UVES data (Hanuschik 2003), with a resolution of 15 Å. The positions of the strongest lines following Lyα pumping are indicated by the vertical lines, numbered as in Fig. 6.
Other Images in This Article

Copyright and Terms & Conditions
© 2006. The American Astronomical Society. All rights reserved. Printed in U.S.A.
Copyright ©
2025 Astronomy Image Explorer. All Rights Reserved.