Image Details
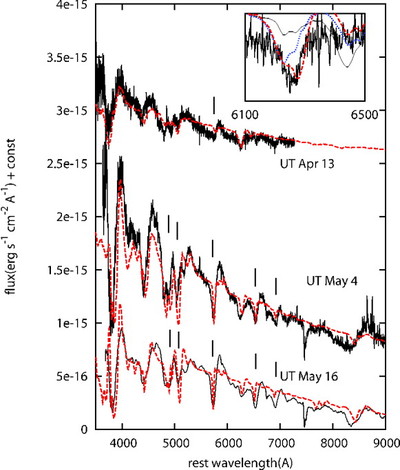
Caption: Fig. 4.
Spectra of SN 2005bf (thick lines: 2005 April 13 [FLWO], M. Modjaz et al. 2005, in preparation; May 4 [HCT], Anupama et al. 2005; May 16 [Subaru Telescope], K. Kawabata et al. 2005, in preparation) compared to the synthetic spectra (dashed lines) computed with the model (﹩M_{\mathrm{ej}\,\,}/ M_{\odot }﹩, ﹩E_{51}﹩) = (7, 1.3). The position of the He lines is shown by tick marks. The absorptions near 4900 and 5100 Å are blended with Fe II lines. The inset shows the absorption near 6300 Å in the April 13 spectrum. The model with H at ﹩v\gtrsim \,13,000﹩ km s−1 (dashed line) provides the best fit. The thin and dotted lines show models with H in the whole ejecta and no H, respectively. See § 3 for details.
Other Images in This Article
Copyright and Terms & Conditions
© 2005. The American Astronomical Society. All rights reserved. Printed in U.S.A.