Image Details
Caption: Fig. 2.
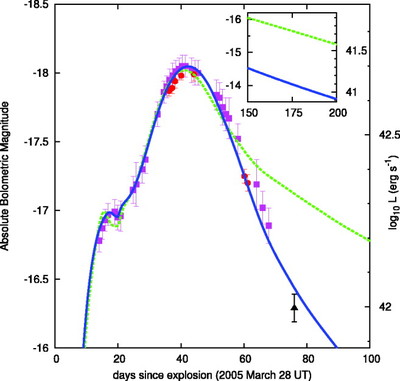
Bolometric light curve constructed from FLWO (filled squares; M. Modjaz et al. 2005, in preparation), HCT (filled circles; Anupama et al. 2005), and MAGNUM (filled triangle; N. Inada et al. 2005, in preparation) photometry. The contribution of near‐IR light is between ~20% of the total at early phases and ~50% at late phases. Synthetic light curves are shown for normal (dashed line) and reduced (solid line) γ‐ray opacities (see text). The inset shows the predicted LCs of each model when SN 2005bf emerges from behind the Sun in fall 2005. See § 2 for details.
Other Images in This Article
Copyright and Terms & Conditions
© 2005. The American Astronomical Society. All rights reserved. Printed in U.S.A.
Copyright ©
2025 Astronomy Image Explorer. All Rights Reserved.