Image Details
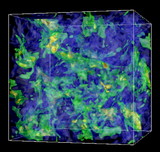
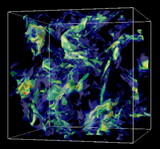
Caption: Fig. 4.
Time‐averaged core mass distribution resulting from TVD simulations. The two dot‐dashed lines with slopes of −0.5 and −1.3 are shown for comparison with the mass functions of giant molecular clouds and protostellar cores, respectively.
Other Images in This Article
Copyright and Terms & Conditions
© 2006. The American Astronomical Society. All rights reserved. Printed in U.S.A.
Copyright ©
2025 Astronomy Image Explorer. All Rights Reserved.