Image Details
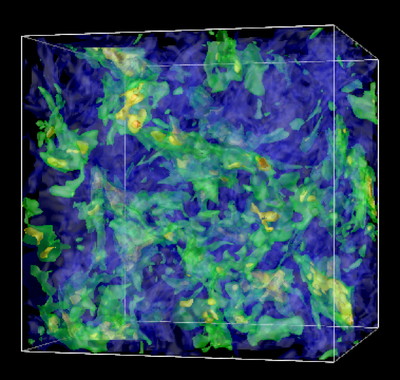
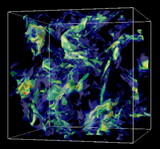
Caption: Fig. 3.
Snapshots of the TVD runs with (a) ﹩M_{s}=1﹩ at ﹩t=5\tau _{\mathrm{turb}\,}﹩ and (b) ﹩M_{s}=6﹩ at ﹩t=4.5\tau _{\mathrm{turb}\,}﹩. Note how the turbulent fragmentation of the medium is different for different Mach numbers. Blue, green, yellow, orange, and red colors represent isodensity surfaces with 1, 2, 3, 4, and 5 times the mean density in (a). In (b), the same order of colors represents isodensity surfaces with 5, 11.25, 17.5, 23.75, and 30 times the mean value.
Other Images in This Article
Copyright and Terms & Conditions
© 2006. The American Astronomical Society. All rights reserved. Printed in U.S.A.
Copyright ©
2025 Astronomy Image Explorer. All Rights Reserved.