Image Details
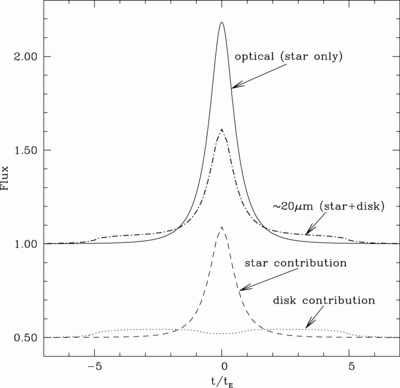
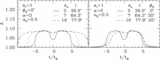
Caption: Fig. 5.
Contributions of star and disk to the lensing signal. The plot assumes that the star and the disk have the same unlensed flux at ~20 μm. The dot‐dashed curve shows the total lensed flux at ~20 μm, which is the sum of that from the star (dashed curve) and that from the disk (dotted curve). The solid curve is the lensed flux in optical where only the star is visible. The lensing of the star+disk system is apparently chromatic because the system has different spatial structures in optical and in mid‐infrared.
Other Images in This Article
Copyright and Terms & Conditions
© 2005. The American Astronomical Society. All rights reserved. Printed in U.S.A.
Copyright ©
2025 Astronomy Image Explorer. All Rights Reserved.