Image Details
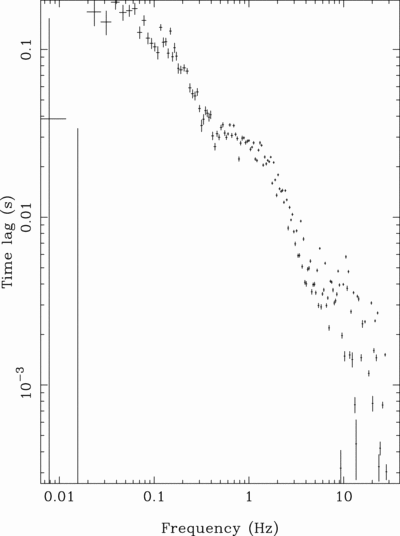
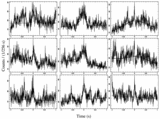
Caption: Fig. 14.
Hard‐band time lags in the hard state. The time lags of the 26.5–60 keV band light curve relative to the 2–3 keV band calculated with the cross spectrum are plotted as a function of frequency.
Other Images in This Article
Show More
Copyright and Terms & Conditions
Copyright is not claimed for this article. Printed in U.S.A.
Copyright ©
2025 Astronomy Image Explorer. All Rights Reserved.