Image Details
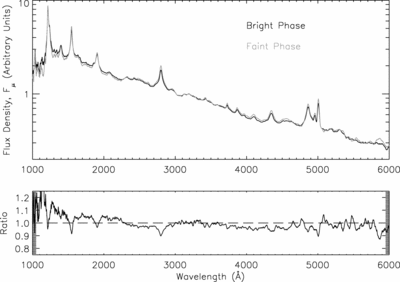
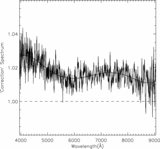
Caption: Fig. 12.
Top: Bright‐ (black line) and faint‐phase (gray line) arithmetic mean composite spectra for the 315 objects in the final variable quasar sample. As both composites were created from quasar spectra scaled to a value of 1 at 3060 Å, only relative color changes are meaningful. Both spectra are boxcar smoothed with a smoothing length of 20 pixels. Bottom: Ratio of bright‐phase composite to faint‐phase composite as a function of wavelength.
Other Images in This Article
Show More
Copyright and Terms & Conditions
© 2005. The American Astronomical Society. All rights reserved. Printed in U.S.A.
Copyright ©
2025 Astronomy Image Explorer. All Rights Reserved.