Image Details
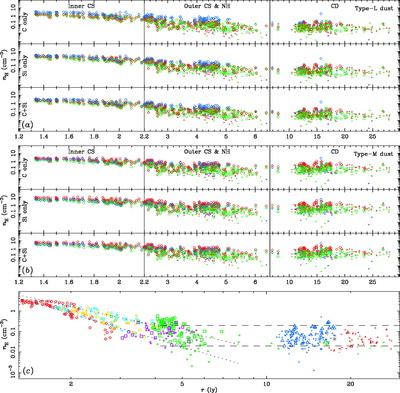
Caption: Fig. 46.
Gas density vs. radius for the dust scattering model. Model results are shown for (a) type‐L and (b) type‐M dust. Each filter is shaded its (roughly) corresponding color: F470 in blue, F612 in green, F688 in red. Large circles denote signal‐to‐noise above 2, and small ones show ﹩\mathrm{S}\,/ \mathrm{N}\,< 2﹩. The abscissa changes between columns, each of which contains the structure as noted in the top subpanel. Rows show the results for the dust compositions listed to the far left. (c) Average gas densities that match observed echo fluxes to the dust‐scattering model. Note that the abscissa is shown in now logarithmic. Point colors correspond to those in Fig. 43. CS material is marked by circles, NH by squares, CD by triangles, and smaller symbols denote measurements with ﹩\mathrm{S}\,/ \mathrm{N}\,< 2﹩. Dotted lines are the best fits through the upper and lower CS loci, corresponding to ﹩n\propto r^{-3.0}﹩ (upper) and ﹩n\propto r^{-4.5}﹩ (lower). Horizontal dashed lines delineate the rough density boundaries of the CD gas.
Other Images in This Article
Show More
Copyright and Terms & Conditions
© 2005. The American Astronomical Society. All rights reserved. Printed in U.S.A.