Image Details
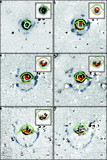
Caption: Fig. 5.
Average integrated scattering function S(λ, μ), integrated over the total spectrum ﹩F( \lambda ) ﹩ of SN 1987A (Fig. 4) and filter profiles (Fig. 7). Line style designates composition: solid lines show carbonaceous dust, and dotted lines show silicates. Columns are calculated for a given filter, and rows are calcuated for LMC dust with grain‐size range types L, M, and S, as noted at upper right in each panel. This integral gives the energy scattered toward the observer in unit time by a unit volume of gas with unit density located unit distance from the source.
Other Images in This Article
Show More
Copyright and Terms & Conditions
© 2005. The American Astronomical Society. All rights reserved. Printed in U.S.A.
Copyright ©
2025 Astronomy Image Explorer. All Rights Reserved.