Image Details

Caption: Fig. 24.
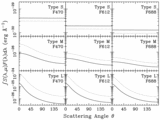
Cross sections of CD material, viewed along a hypothetical symmetry axis with inclination as noted in each panel. All data are normalized by their average distance ![]() π﹩\arcmin﹩
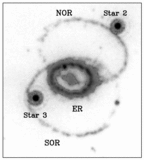
π﹩\arcmin﹩![]() measured in bins along ﹩z^{\prime }﹩. Labels ﹩x^{\prime }﹩ and ﹩y^{\prime }﹩ are the Cartesian axes defined in Fig. 12. Symbols are the same as Fig. 19, except all shell material is designated by open circles, which are shaded gray to facilitate the viewing of other symbols. Comparison of this figure with Fig. 25 shows the most probable CD inclination is near ﹩i_{x}=40^{\circ }﹩ (see text, § 6.1.4).
measured in bins along ﹩z^{\prime }﹩. Labels ﹩x^{\prime }﹩ and ﹩y^{\prime }﹩ are the Cartesian axes defined in Fig. 12. Symbols are the same as Fig. 19, except all shell material is designated by open circles, which are shaded gray to facilitate the viewing of other symbols. Comparison of this figure with Fig. 25 shows the most probable CD inclination is near ﹩i_{x}=40^{\circ }﹩ (see text, § 6.1.4).
Other Images in This Article
Show More
Copyright and Terms & Conditions
© 2005. The American Astronomical Society. All rights reserved. Printed in U.S.A.
Copyright ©
2025 Astronomy Image Explorer. All Rights Reserved.