Image Details

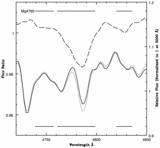
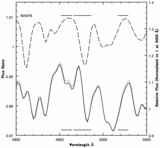
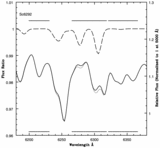
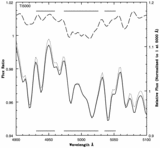
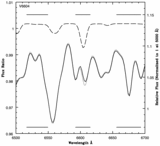
Caption: Fig. 3.
Al3953 index definition (horizontal lines). The Al‐enhanced (dotted curve) and normal (solid curve) spectra are overplotted near the bottom. The ratio spectra for Al‐enhanced and Ca‐enhanced models are shown toward the top.
Other Images in This Article

Show More
Copyright and Terms & Conditions
© 2005. The American Astronomical Society. All rights reserved. Printed in U.S.A.
Copyright ©
2025 Astronomy Image Explorer. All Rights Reserved.