Image Details
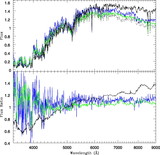
Caption: Fig. 2.
CNO3862 index definition (horizontal lines). The relative spectral responses due to increased oxygen (solid curve), carbon (dashed curve), and nitrogen (dotted curve) abundances are also shown in the same spectral region.
Other Images in This Article

Show More
Copyright and Terms & Conditions
© 2005. The American Astronomical Society. All rights reserved. Printed in U.S.A.
Copyright ©
2025 Astronomy Image Explorer. All Rights Reserved.