Image Details
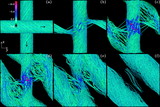
Caption: Fig. 9.
Plot of α for the RR6 tunnel simulation of Fig. 7. The solid line shows the initial state (﹩tv_{\mathrm{A}\,}/ R=0﹩) at ﹩y=z=0﹩, while the dashed line shows the final, tunneled state (at ﹩tv_{\mathrm{A}\,}/ R=159﹩). The inset gray‐scale plots show α at the same times in the ﹩z=0﹩ plane, where the left plot is the initial state and the right plot is the final state. Here black is ﹩4\pi \alpha / c=-15﹩ and white is ﹩4\pi \alpha / c=15﹩. This shows that the two tubes evolve toward constant α fields during their reconnection.
Other Images in This Article
Show More
Copyright and Terms & Conditions
© 2005. The American Astronomical Society. All rights reserved. Printed in U.S.A.
Copyright ©
2025 Astronomy Image Explorer. All Rights Reserved.