Image Details
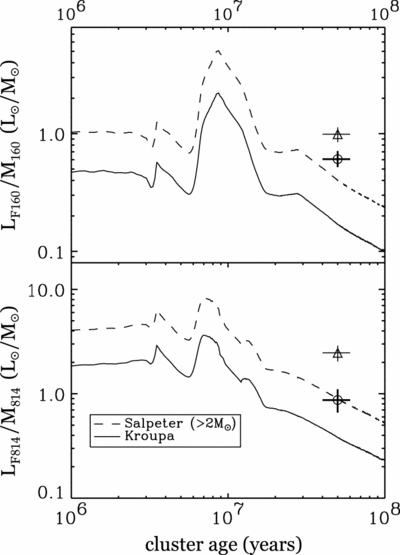
Caption: Fig. 5.
Comparison of the derived L/M ratios with predictions from Starburst99 models for two IMFs. The L/M ratio for the cluster is clearly inconsistent with a normal Kroupa IMF. The H band is shown in the top panel, and the I band is shown in the bottom panel. Circles mark L/M based on extinction estimates derived from synthetic photometry (§ 4.2), while triangles mark values based on the SG01 extinction estimate.
Other Images in This Article
Copyright and Terms & Conditions
© 2005. The American Astronomical Society. All rights reserved. Printed in U.S.A.
Copyright ©
2025 Astronomy Image Explorer. All Rights Reserved.