Image Details
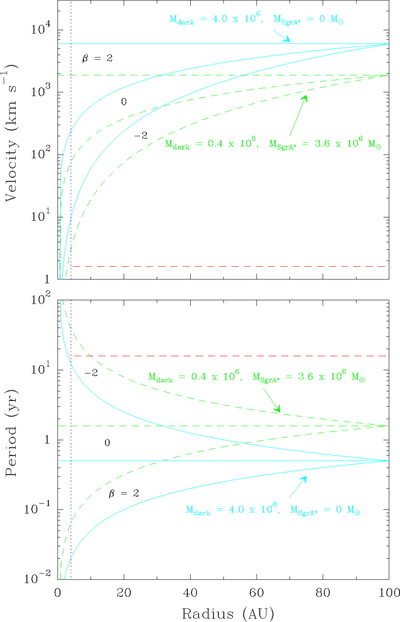
Caption: Fig. 6.
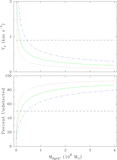
Expected velocity (top) and orbital period (bottom) of Sgr A* owing to the gravitational force of hypothetical "dark" matter distributions as a function of radius. A family of curves is plotted for each dark matter/Sgr A* mass pair: solid lines are dark matter dominated and dashed lines are Sgr A* dominated. The total mass is set to ﹩4\times 10^{6}﹩ M⊙ in the central 100 AU region, as required by observed infrared stellar orbits. For each dark matter mass, power‐law distributions of density, ρ, with radius, r, given by ﹩\rho \propto r^{-\beta }﹩ are plotted for ﹩\beta =2﹩, 0, and −2. Horizontal dashed lines indicate our 2 σ measurement uncertainty of 1.8 km s−1 for velocity and 16 yr for the orbital period of Sgr A*; all values above the velocity limit would be ruled out, provided that the orbital period would be longer than the period limit. Note that even though velocities of Sgr A* can be very high, orbital periods are very short and might not be detected (see § 4.1). Vertical dotted lines indicate our lower limit of 4 AU for detection; for radii less than this limit greater velocities are possible. For radii greater than 4 AU position excursions for Sgr A* would be easily detected for any orbital periods.
Other Images in This Article
Copyright and Terms & Conditions
© 2004. The American Astronomical Society. All rights reserved. Printed in U.S.A.