Image Details
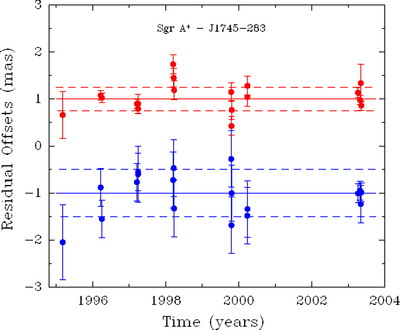
Caption: Fig. 3.
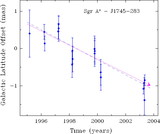
Residual offsets of Sgr A* relative to J1745−283 with best‐fit motions removed. Easterly residuals are plotted above northerly residuals, shifted by +1 and −1 mas, respectively, for clarity. Solid lines indicate zero residual with respect to the best‐fitting motions shown in Fig. 2, and dashed lines indicate estimated limits for any short‐period position excursions of Sgr A*. Data close in time (i.e., ≈1 week) appear slightly correlated, possibly owing to atmospheric systematics. Error bars are 1 σ, including systematic effects of mismodeled atmospheric delays.
Other Images in This Article
Copyright and Terms & Conditions
© 2004. The American Astronomical Society. All rights reserved. Printed in U.S.A.
Copyright ©
2025 Astronomy Image Explorer. All Rights Reserved.