Image Details
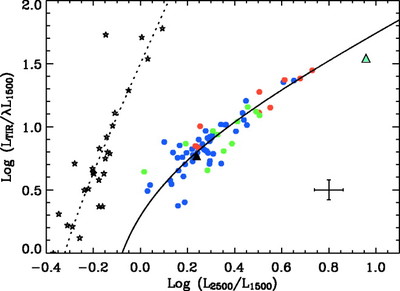
Caption: Fig. 5.
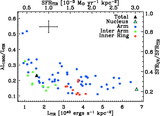
IR/1500 Å luminosity ratio plotted vs. the UV color (L2500/L1500 ratio). The symbols are the same as in Fig. 4. The solid curve gives the linear fit [﹩L_{\mathrm{TIR}\,}/ \lambda L_{1500}=-2.42+3.81( L_{2500}/ L_{1500}) ﹩] to the M81 data. The star symbols give the observations for a sample of starburst galaxies, and the dotted line gives the Meurer et al. (1999) relationship determined for starburst galaxies. Representative uncertainties are shown.
Other Images in This Article
Copyright and Terms & Conditions
© 2004. The American Astronomical Society. All rights reserved. Printed in U.S.A.
Copyright ©
2025 Astronomy Image Explorer. All Rights Reserved.