Image Details
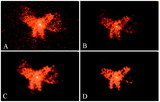
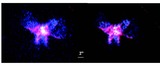
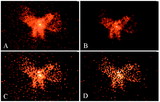
Caption: Fig. 7.
Shown is a simulated example. (a) The data and (b) the PSF are shown with the color map on the square root scale to best illustrate the variability of the counts in these images. EMC2 was run using two priors on the smoothing parameters, ﹩p( \alpha ) \propto \mathrm{exp}\,( -\delta \alpha ^{3}/ 3) ﹩ with ﹩\delta =10﹩ in (c) and (d) and ﹩\delta =1000﹩ in (e) and (f). The reconstructions under the two prior distributions appear in (c) and (e). The corresponding significance maps appear in (d) and (f). The significance maps illustrate the posterior mean divided by the posterior standard deviation. The contour lines in (d) and (f) correspond to levels 3.0 and 10.0, so we are quite confident that the nature of the source is binary. The EMC2 reconstructions were performed with 500 burn‐in iterations and 2000 subsequent iterations used in each of the restorations.
Other Images in This Article
Copyright and Terms & Conditions
© 2004. The American Astronomical Society. All rights reserved. Printed in U.S.A.