Image Details

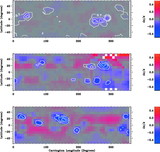
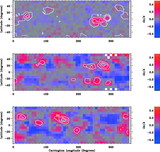
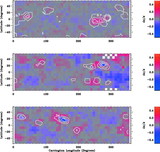
Caption: Fig. 12.
Mode frequency plotted against the magnetic flux value corresponding to the maximum amplitude change, as derived from the quadratic functions whose coefficients are shown in Fig. 11, for ﹩n=3﹩ (plus signs), ﹩n=4﹩ (triangles), ﹩n=5﹩ (diamonds), and ﹩n=6﹩ (circles).
Other Images in This Article

Show More
Copyright and Terms & Conditions
© 2004. The American Astronomical Society. All rights reserved. Printed in U.S.A.
Copyright ©
2025 Astronomy Image Explorer. All Rights Reserved.