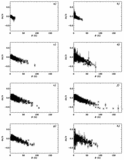
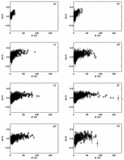
Image Details
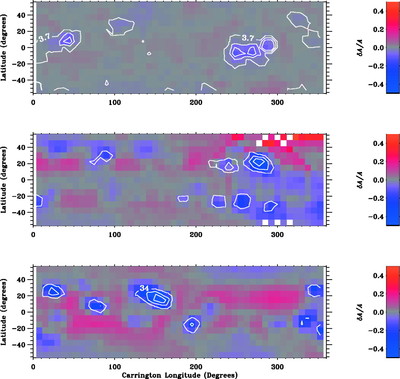
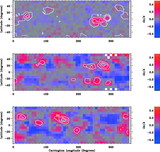
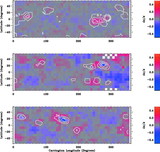
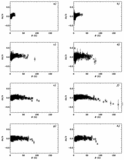
Caption: Fig. 5.
Synoptic charts of MDI fractional mode amplitude changes with respect to the mean for Carrington rotations 1910 in calendar year 1996 (top), 1947 in 1999 (middle), and 1975 in 2001 (bottom), for ﹩l=450,\ n=2﹩ (3030 μHz). The contours represent mean unsigned magnetic flux for each square, with contours at 25%, 50%, and 75% of the maximum value for the rotation.
Other Images in This Article

Show More
Copyright and Terms & Conditions
© 2004. The American Astronomical Society. All rights reserved. Printed in U.S.A.
Copyright ©
2025 Astronomy Image Explorer. All Rights Reserved.